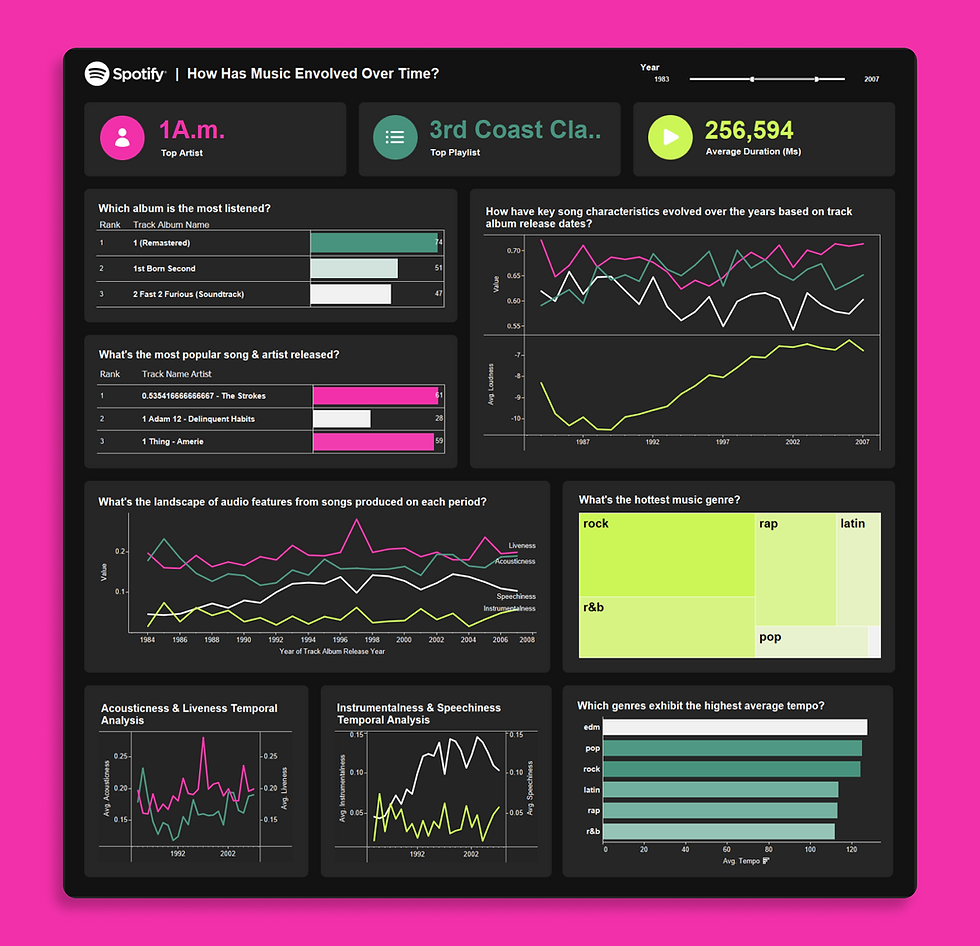
Spotify Music Trend Analysis
I collaborated with a team to analyze Spotify data and uncover music trends over decades, leveraging Tableau and SAS Viya for visualization and analysis. Our dataset, sourced from Spotify's API, contained nearly 30,000 tracks with details on popularity, genres, and audio features like tempo, energy, and valence.
🔗 Here’s a link to the full interactive dashboard in Tableau Public where you can explore the results:
.png)
Goals
-
Identified the most popular songs and artists by period.
-
Revealed trends in audio features, such as increasing tempo and energy over time.
-
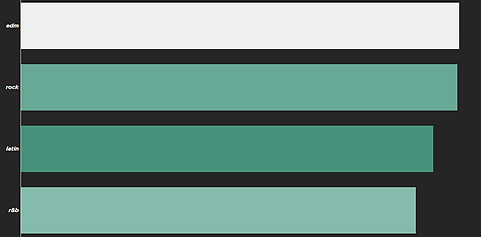
Traced genre popularity shifts, with pop and electronic genres dominating recent decades.
-
Explored the evolution of key song characteristics based on release dates.
Tools & Techniques
-
Tableau Desktop for interactive dashboards and trend analysis.
-
SAS Viya for in-depth statistical exploration and predictive insights.
Business Question and Our Findings
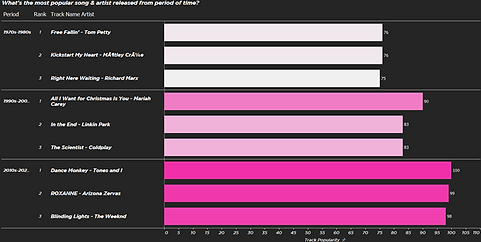
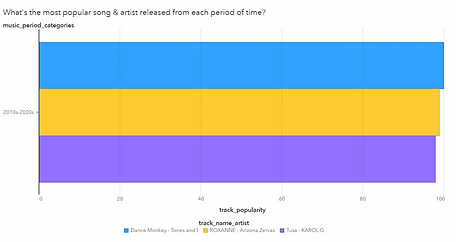
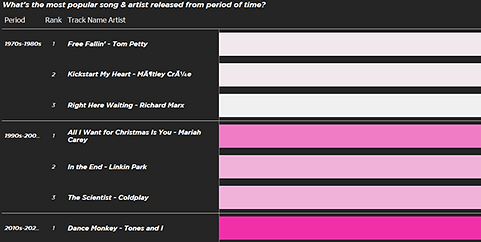
1. What's the most popular song & artist released from each period of time?
Tableau
SAS Viya
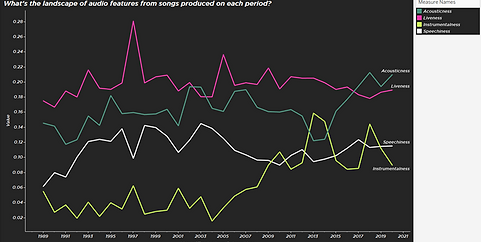
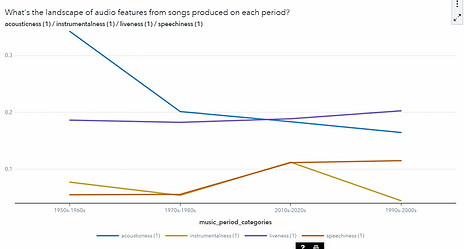
2. What's the landscape of audio features from songs produced in each period?
Tableau
SAS Viya
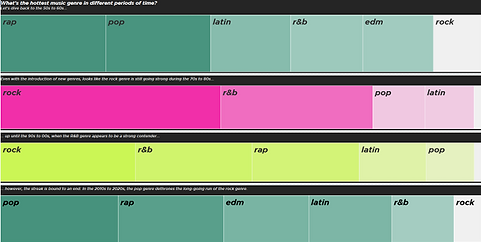
3. What’s the hottest music genre in different periods of time?
Tableau
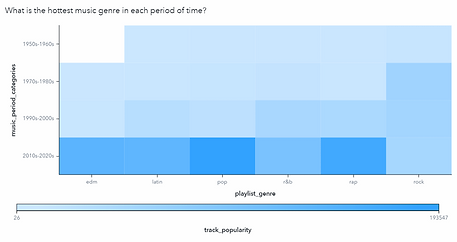
SAS Viya
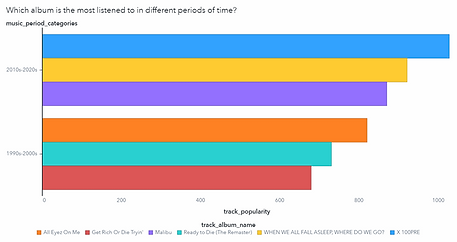
4. Which album is the most listened to in different periods of time?
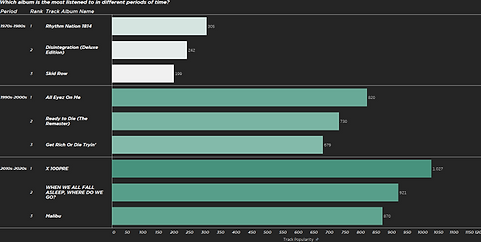
Tableau
SAS Viya
5. How have key song characteristics evolved over the years based on the track album release dates?
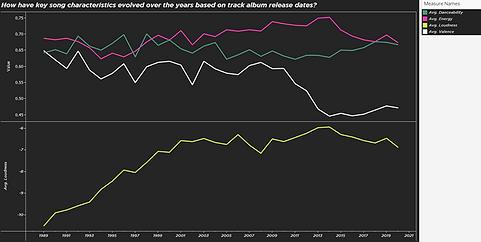
Tableau
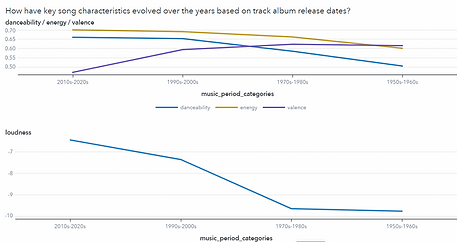
SAS Viya
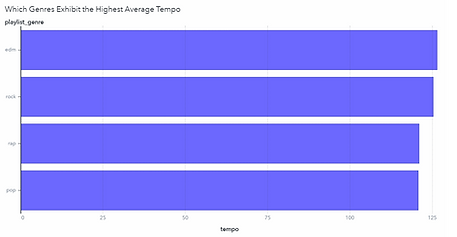
6. Which genres exhibit the highest average tempo in different periods of time?
Tableau
SAS Viya
Key Insights
-
Popular music has trended toward faster tempos and higher energy.
-
Pop and electronic genres continue to dominate, while acoustic tracks have declined.
-
Listener preferences have evolved significantly, influenced by cultural and technological advancements.
Check Out the Dashboard
Here’s a link to the full interactive dashboard in Tableau Public where you can explore the results: